Environment Monitoring Dashboard
Environment Monitory tool is used to monitor all the services running on servers. Currently below project services are added with different environment (DEV, INT, SIT, UAT, DEMO, PROD-TRAIL, PROD).
- Tanya Care
- IPPC
- Primary Care
- ATP
- Global Doctors
- CLMM
New Service Setup
Configure the below 3 steps to setup new service.
- Server Type Setup
- Project Setup
- Service Configuration
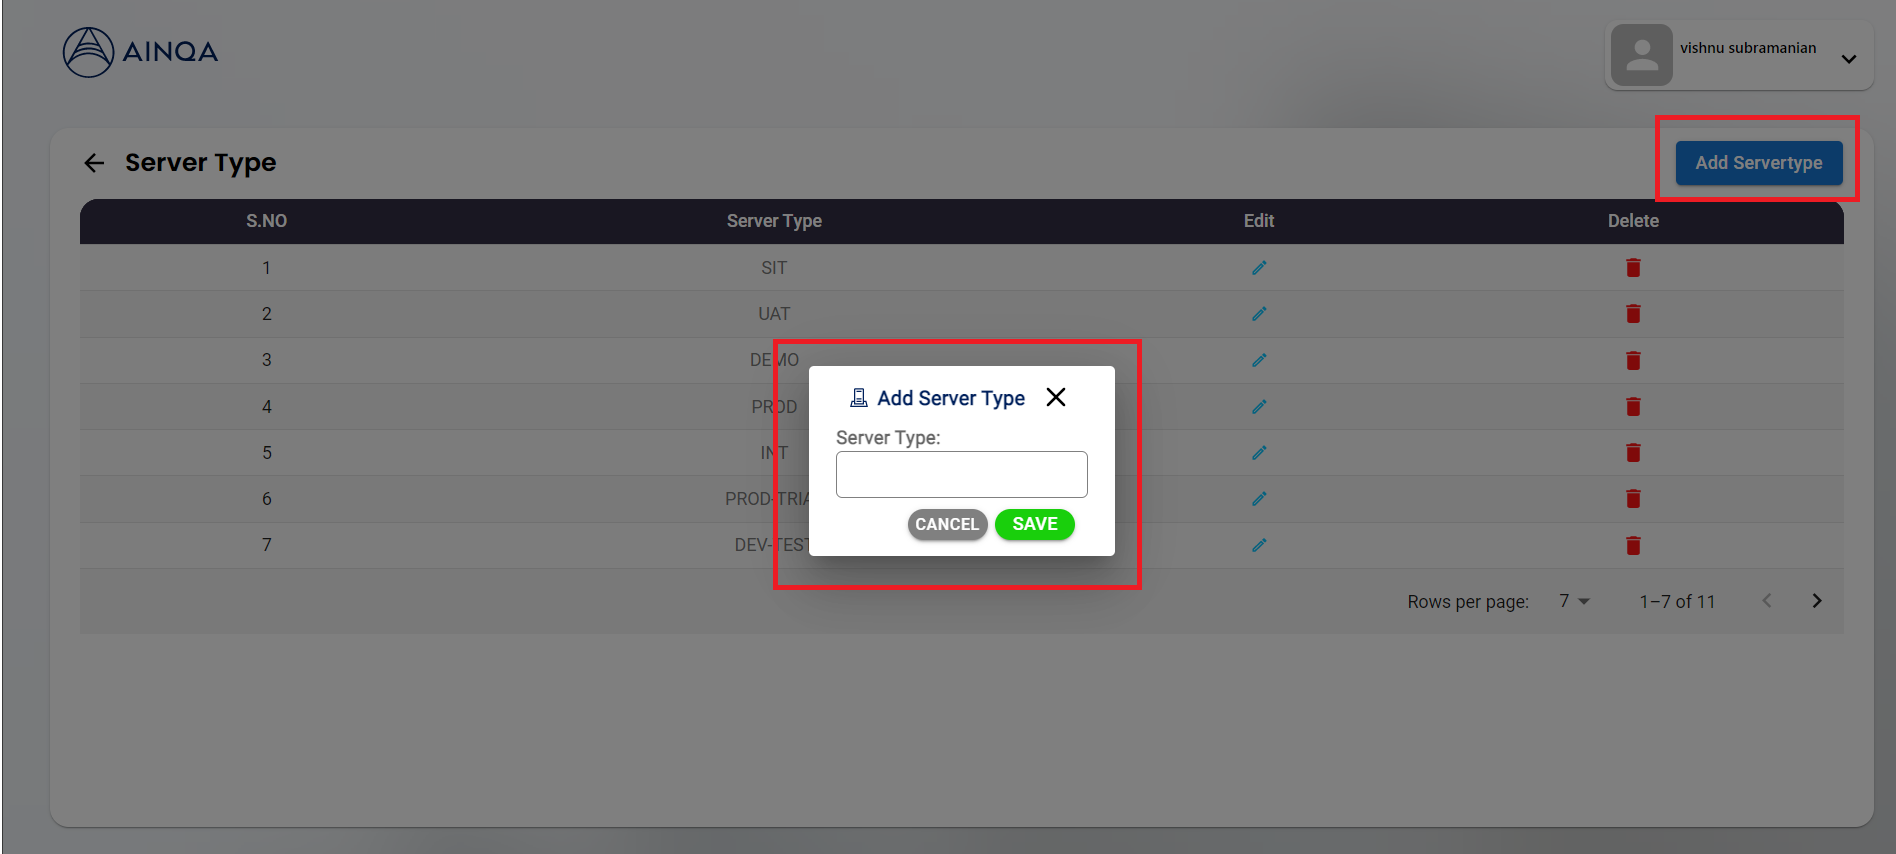
Server Type Setup
Click logged in user name and select View Server Type
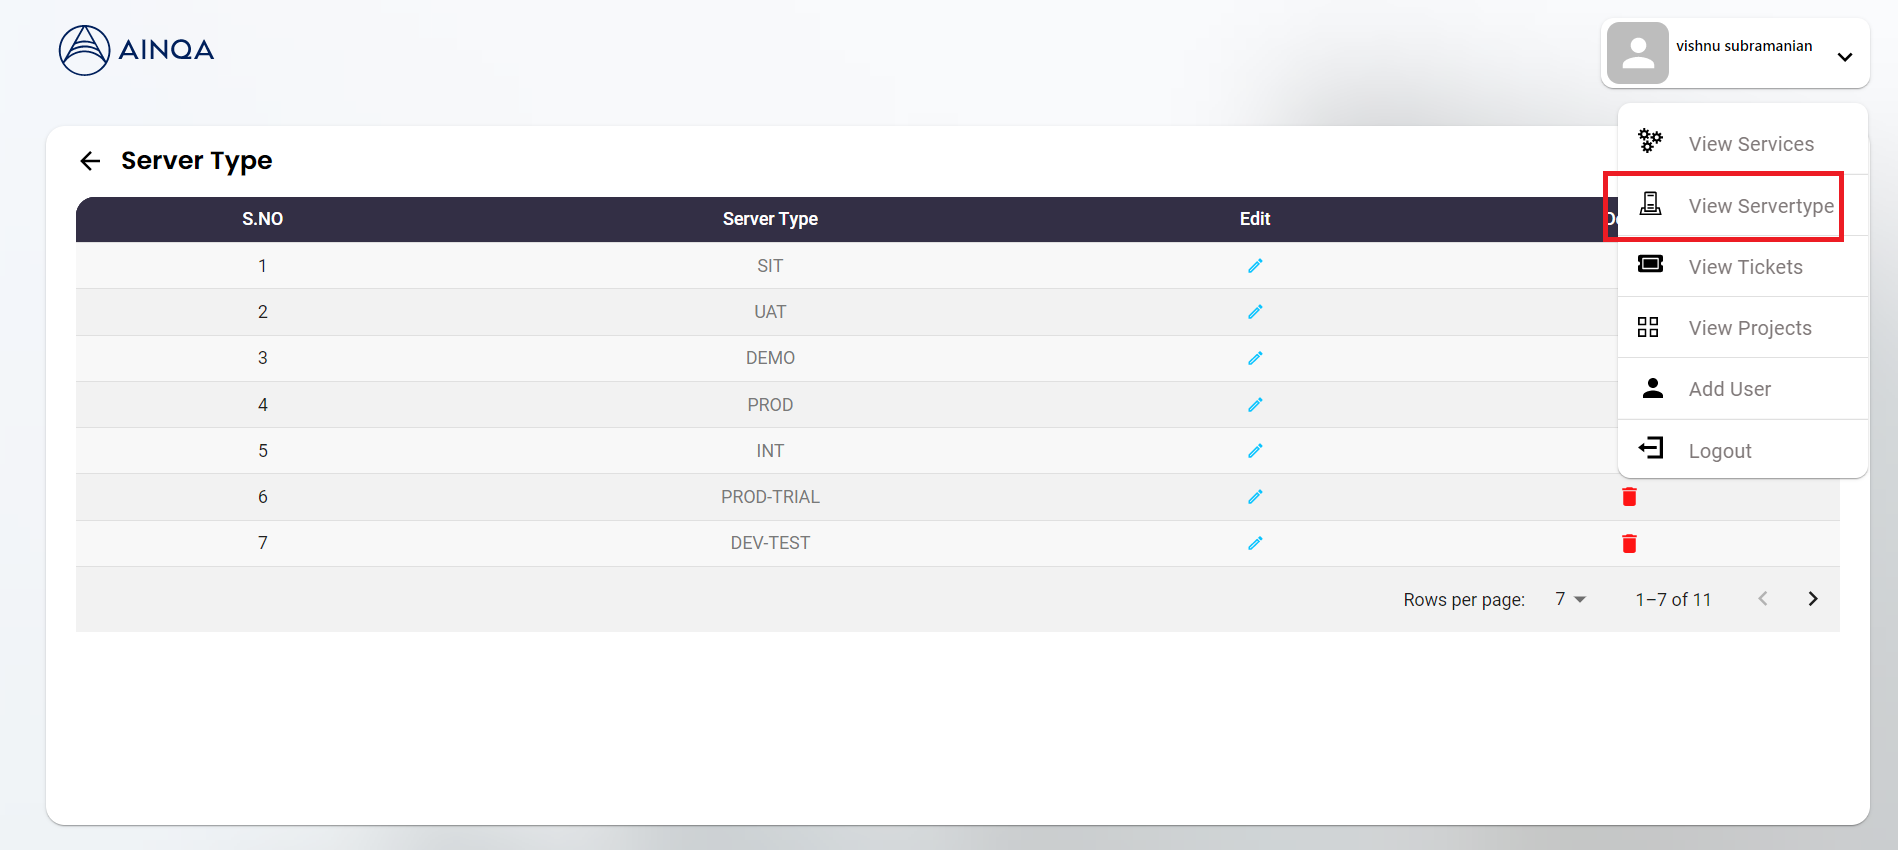
Click Add ServerType button and enter value (eg: Prod, Int, Dev)
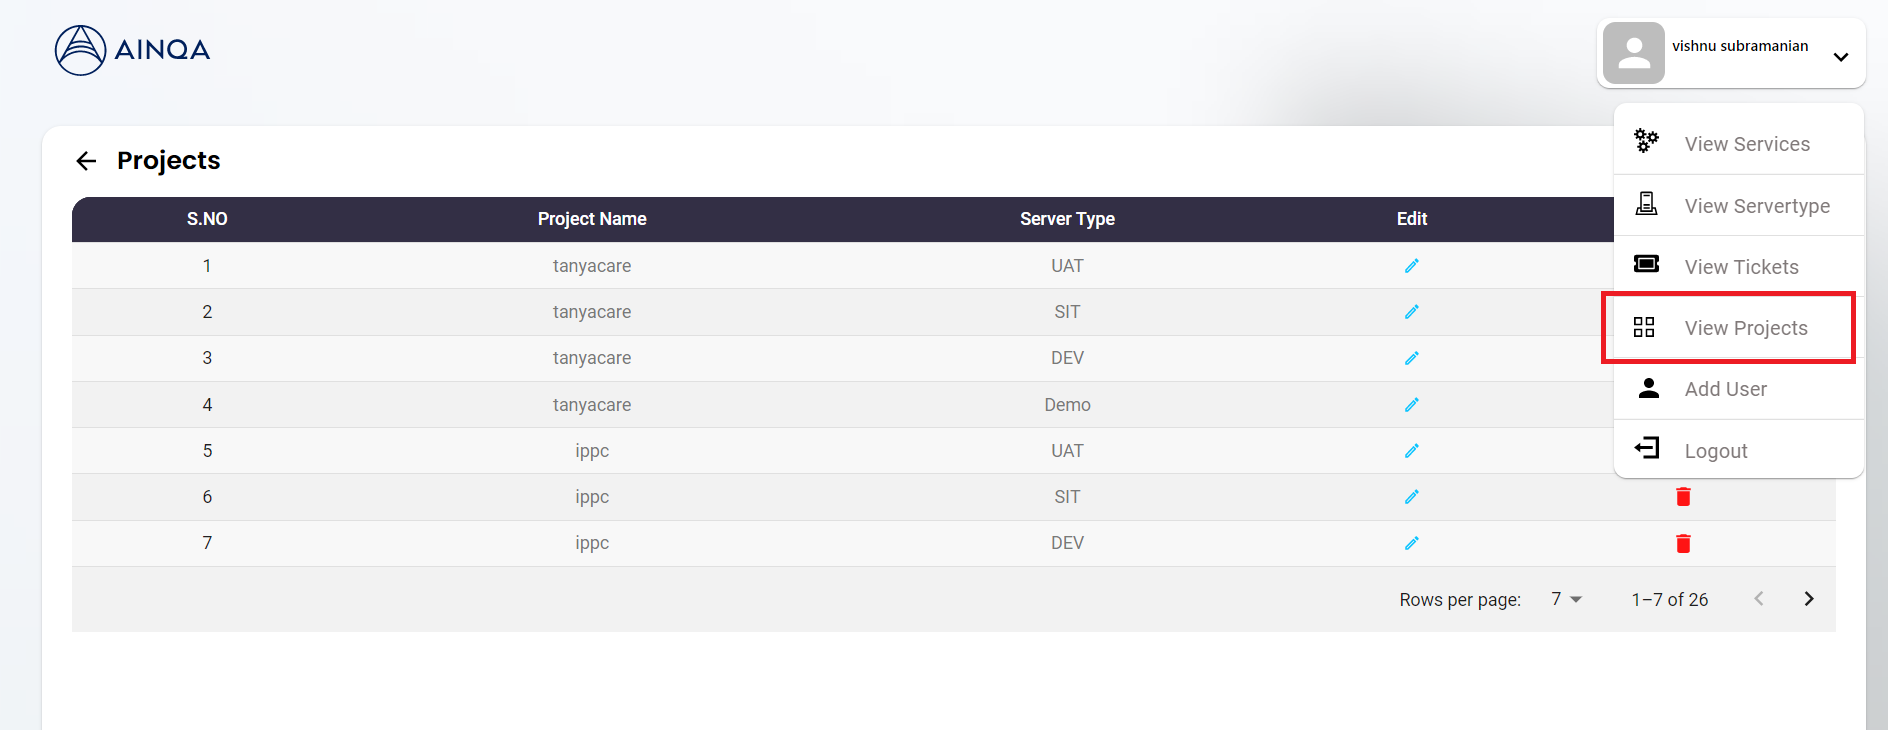
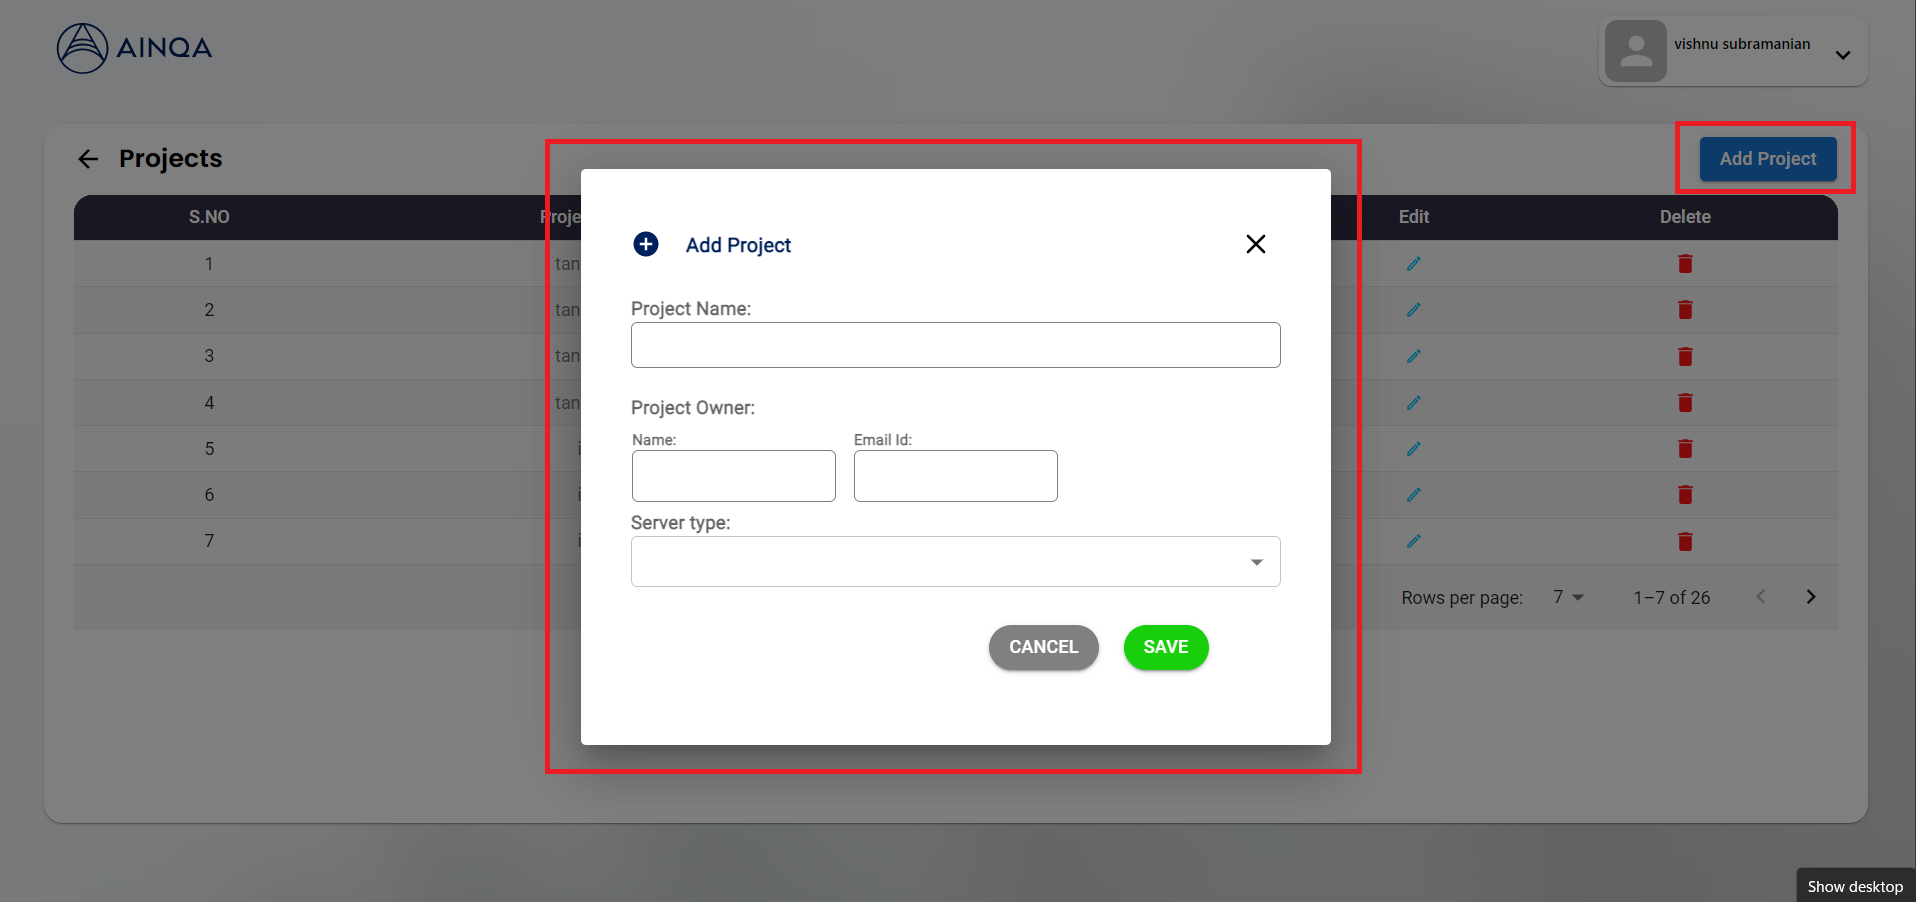
Project Setup
Click logged in user name and select View Projects
Click Add Project button and enter project details.
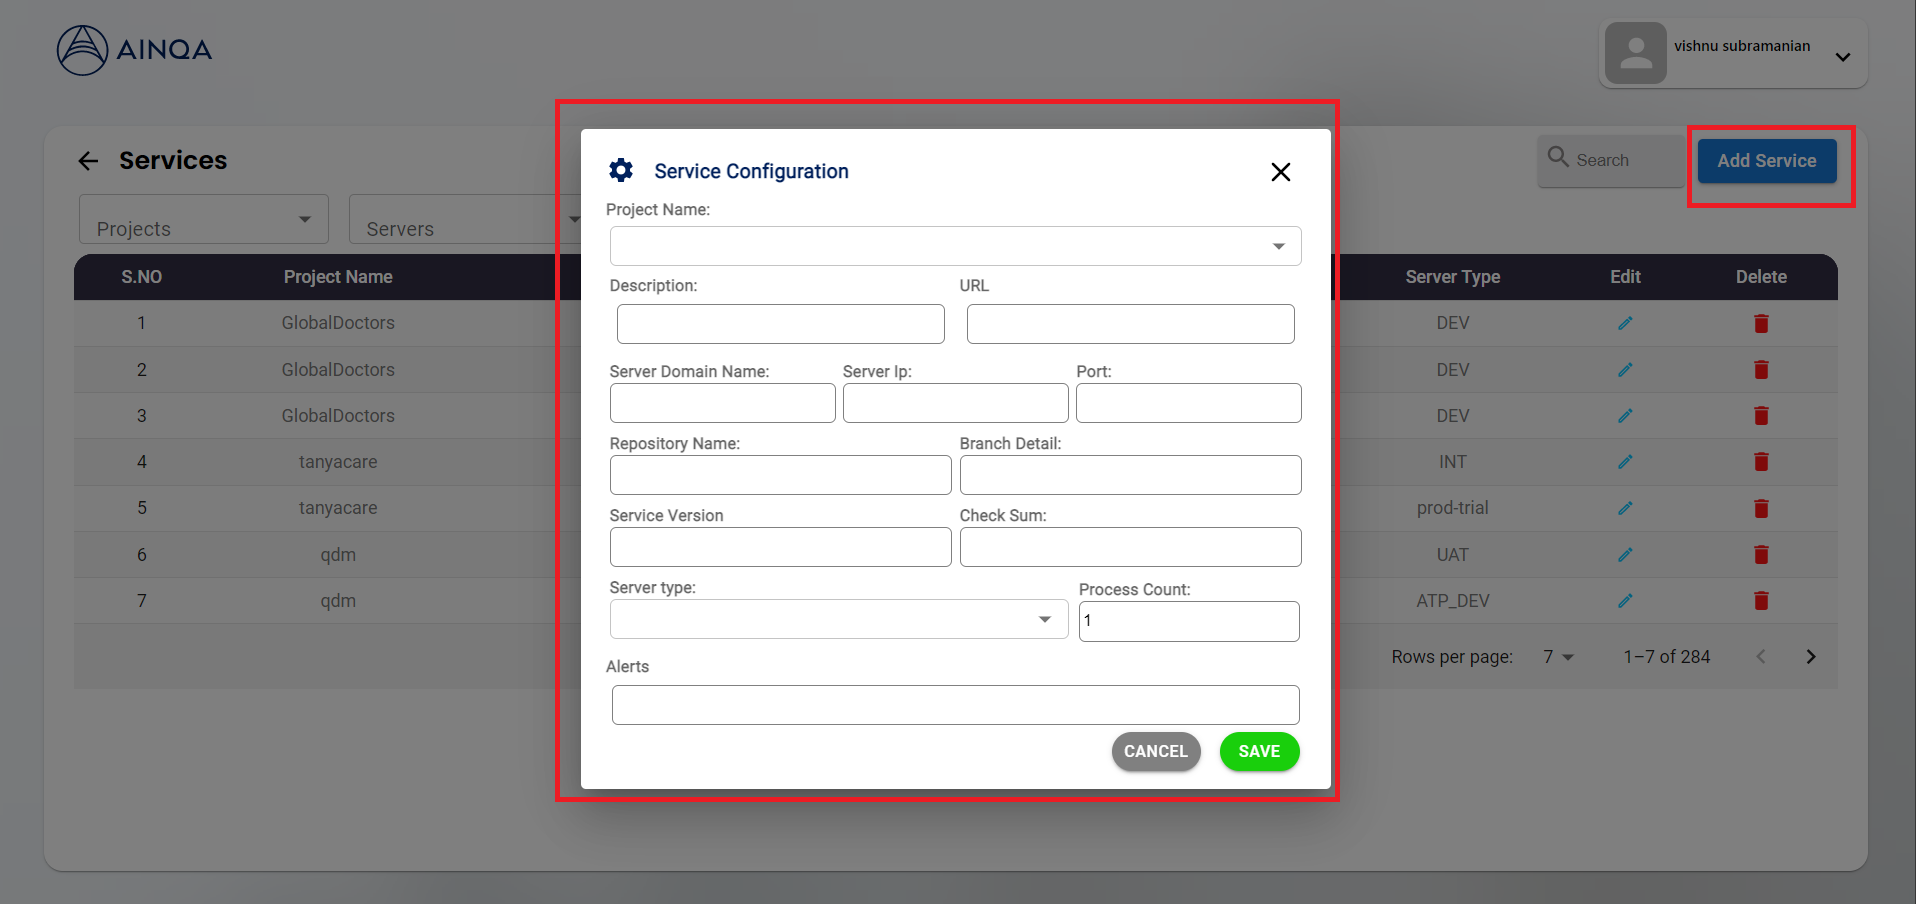
Service Configuration
Click logged in user name and select View Services
Click Add Service button and enter service details.
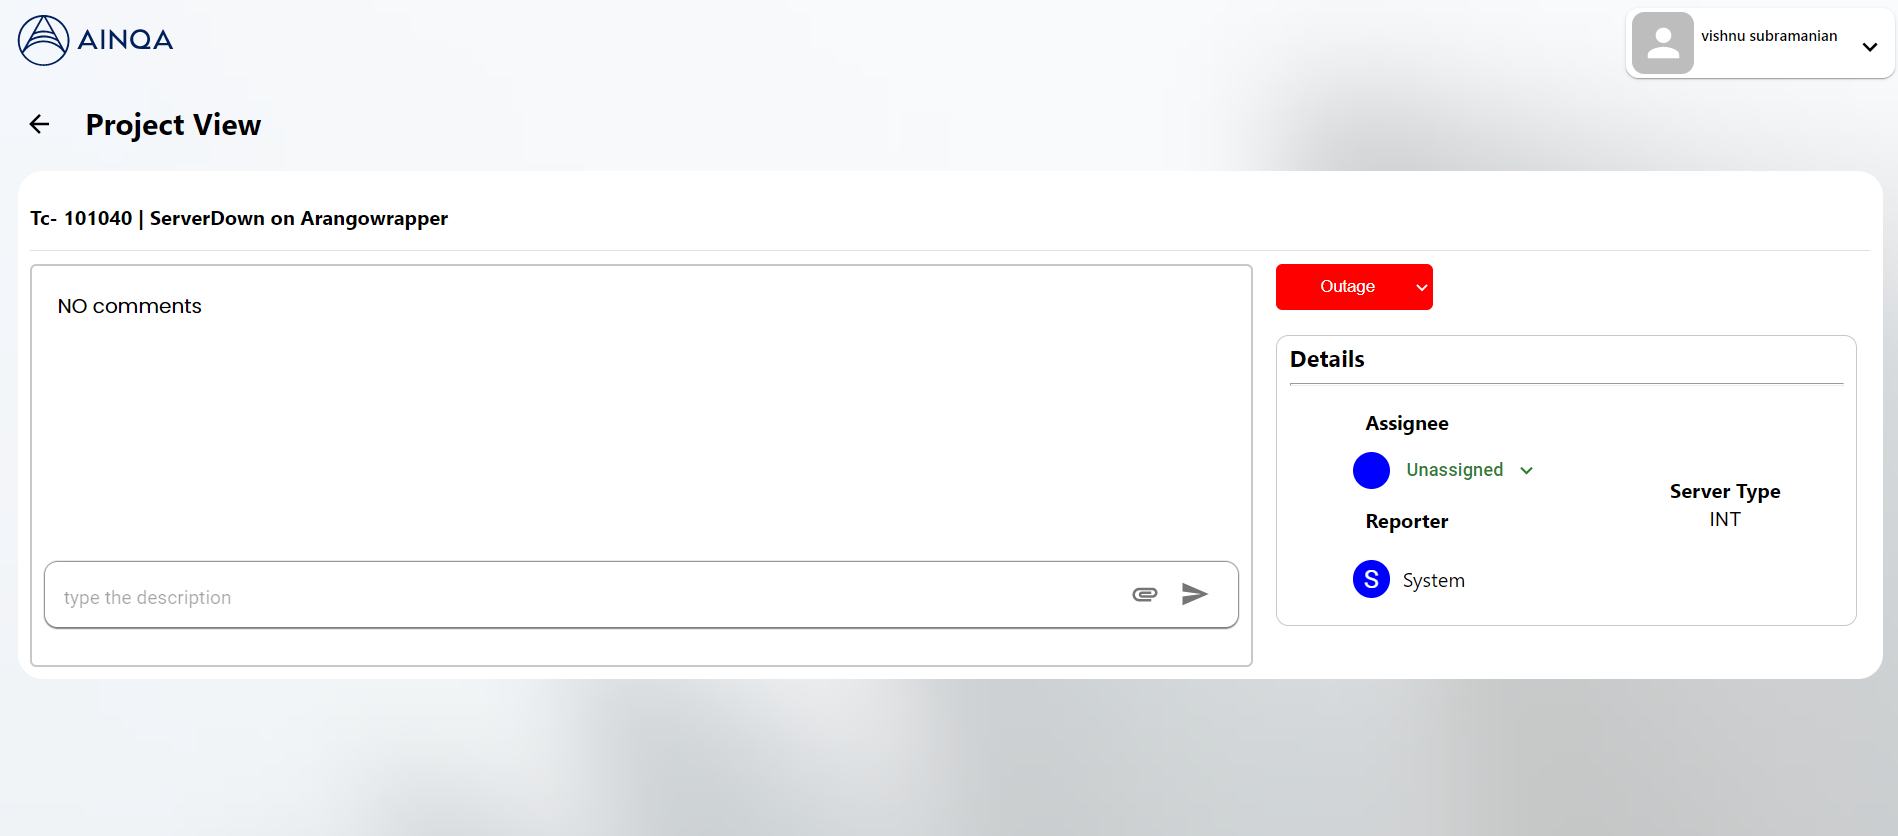
Ticket Creation
It enables user to create ticket in case of service down or failure. Tickets will be created in 2 ways.
- Automatic
- Manual
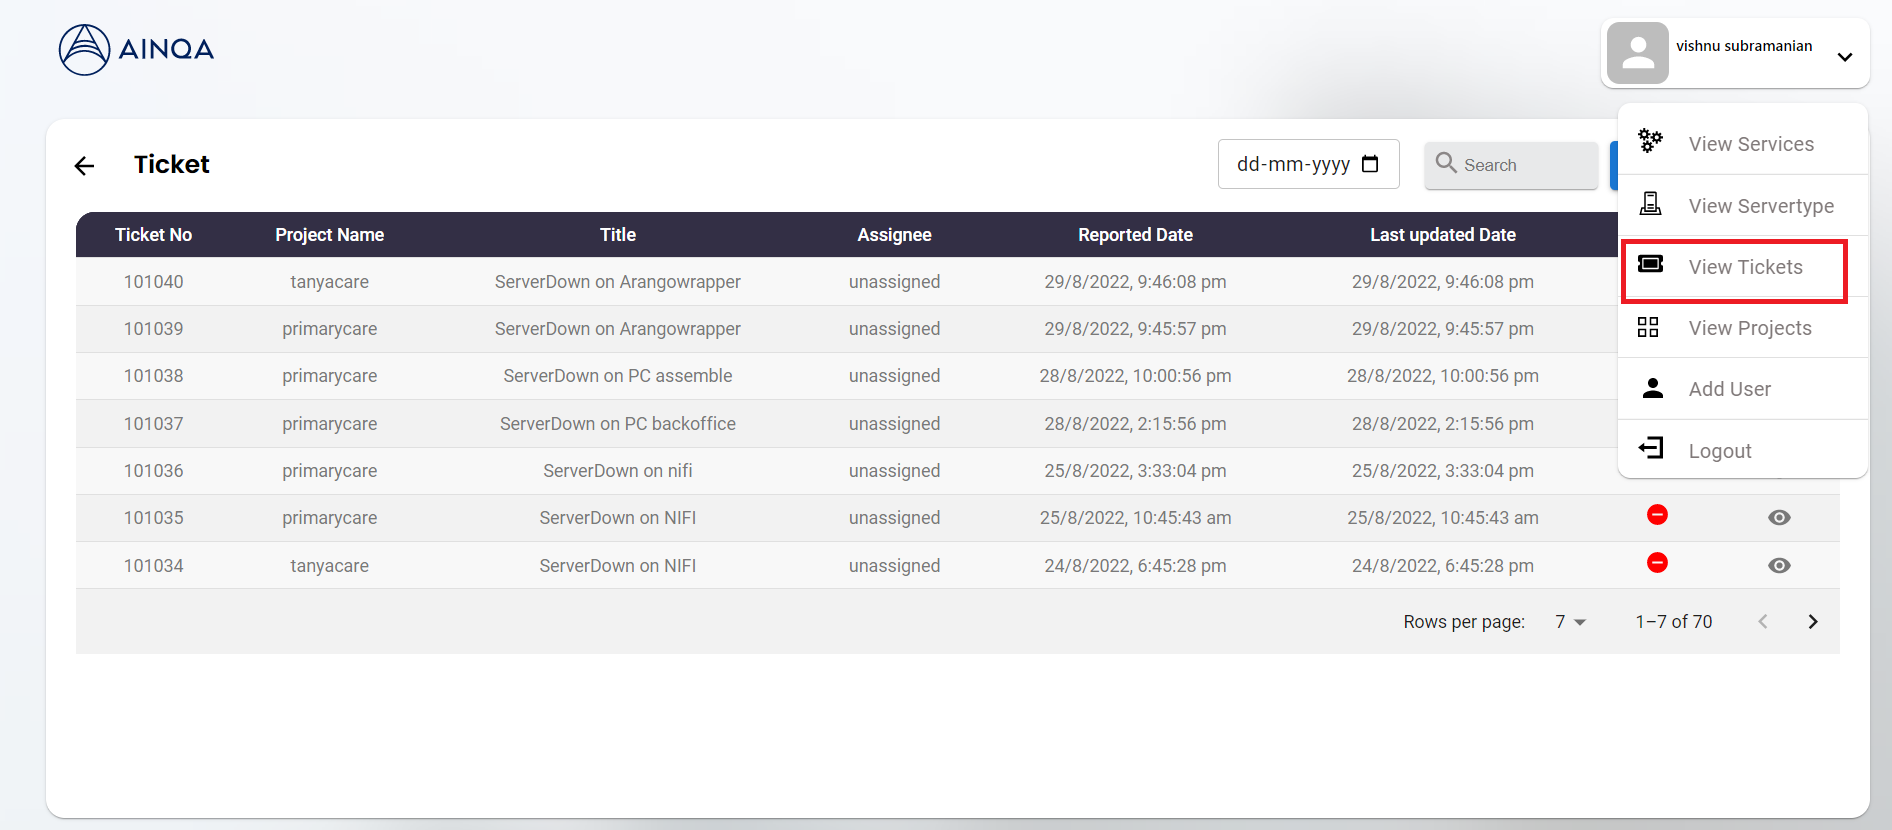
Automatic Ticket Creation
Ticket will be created automatically in case of any service failure using monitoring bots installed in the servers.
Click logged in user name and select View Tickets
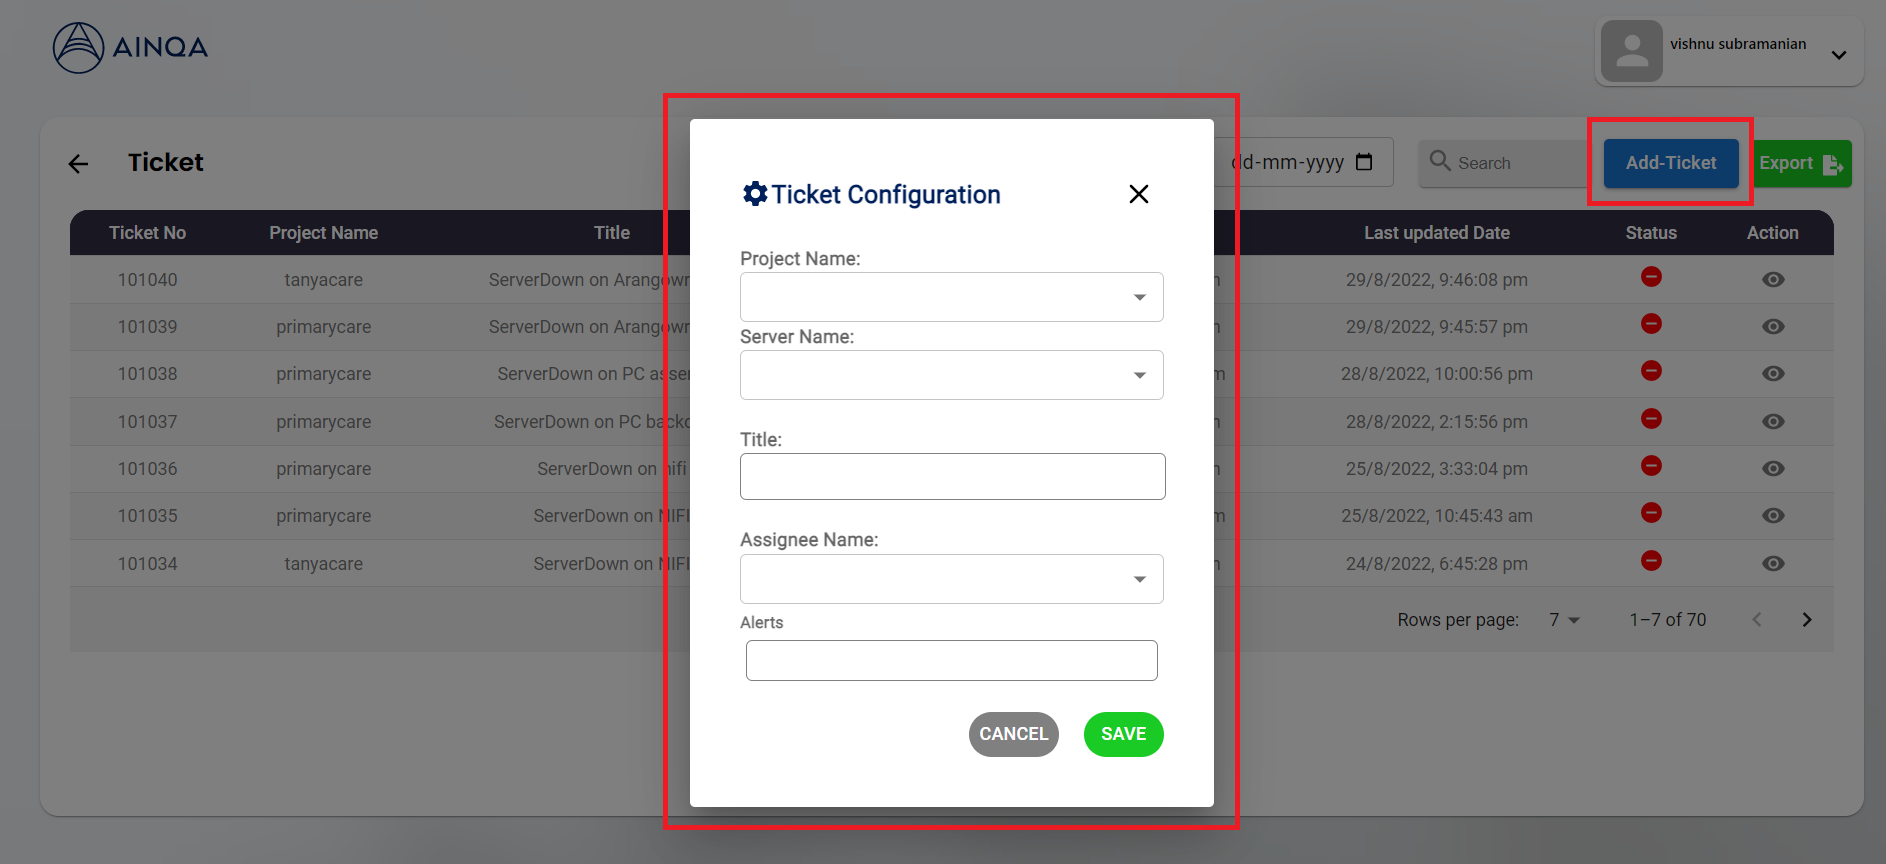
Manual Ticket Creation
It allows user to create manual tickets during maintanence. Click Add Ticket button and enter ticket details.
Project Status
Overall Project Dashboard
Project status dashbord screen with current status (No Issues, Maintanence, Notice, Incident, Outage) of all projects.
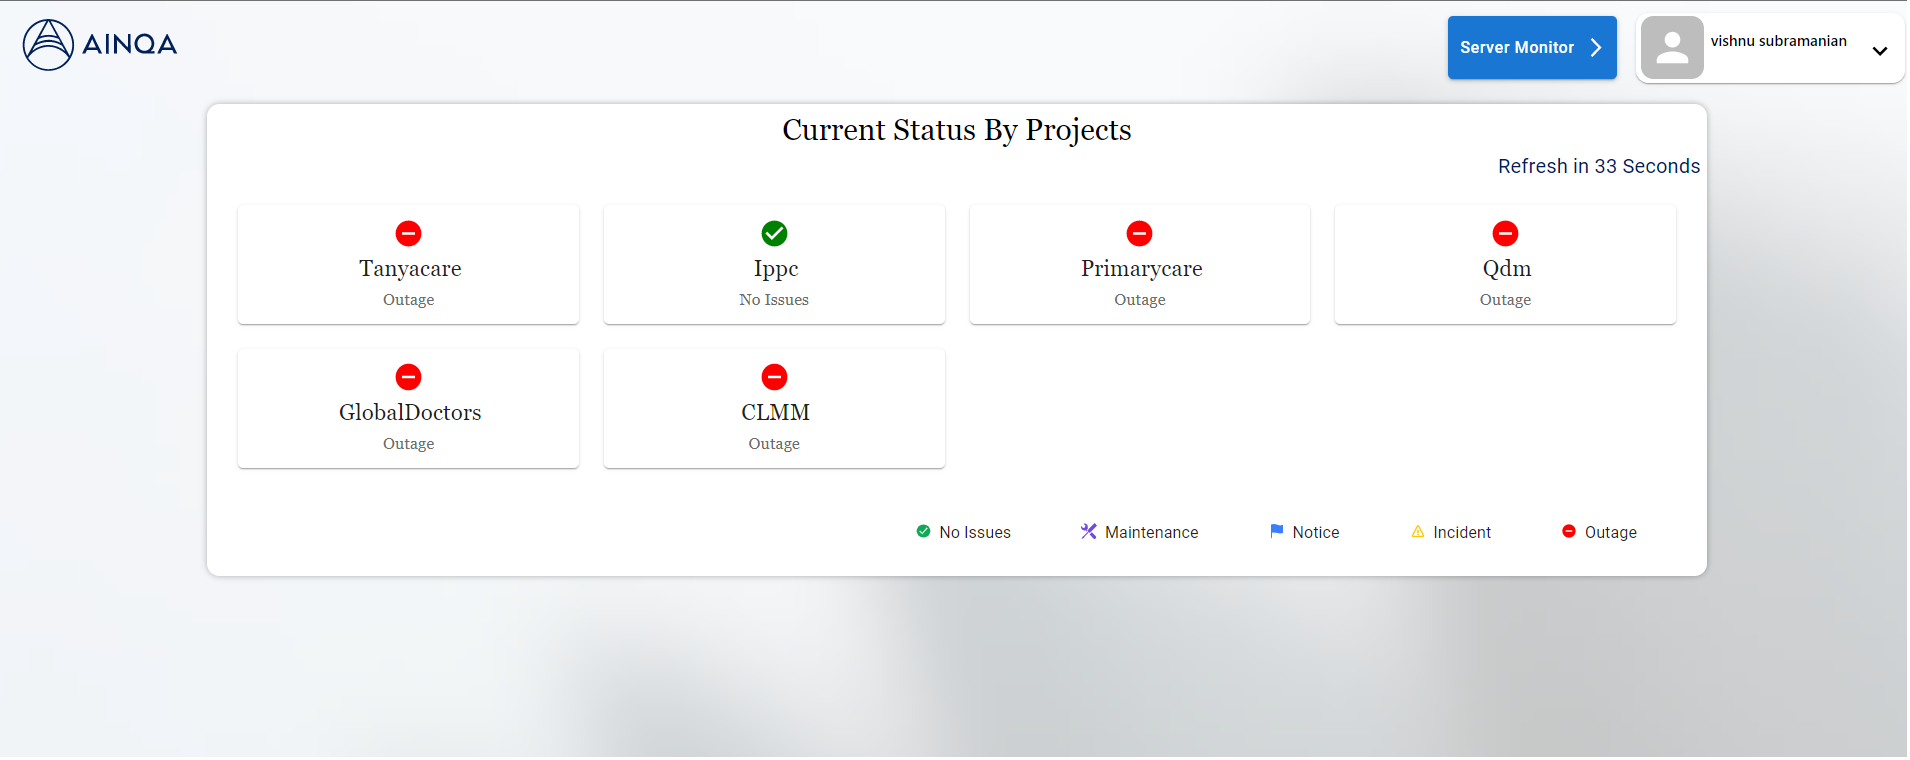
Click on any project and it shows the status by environment
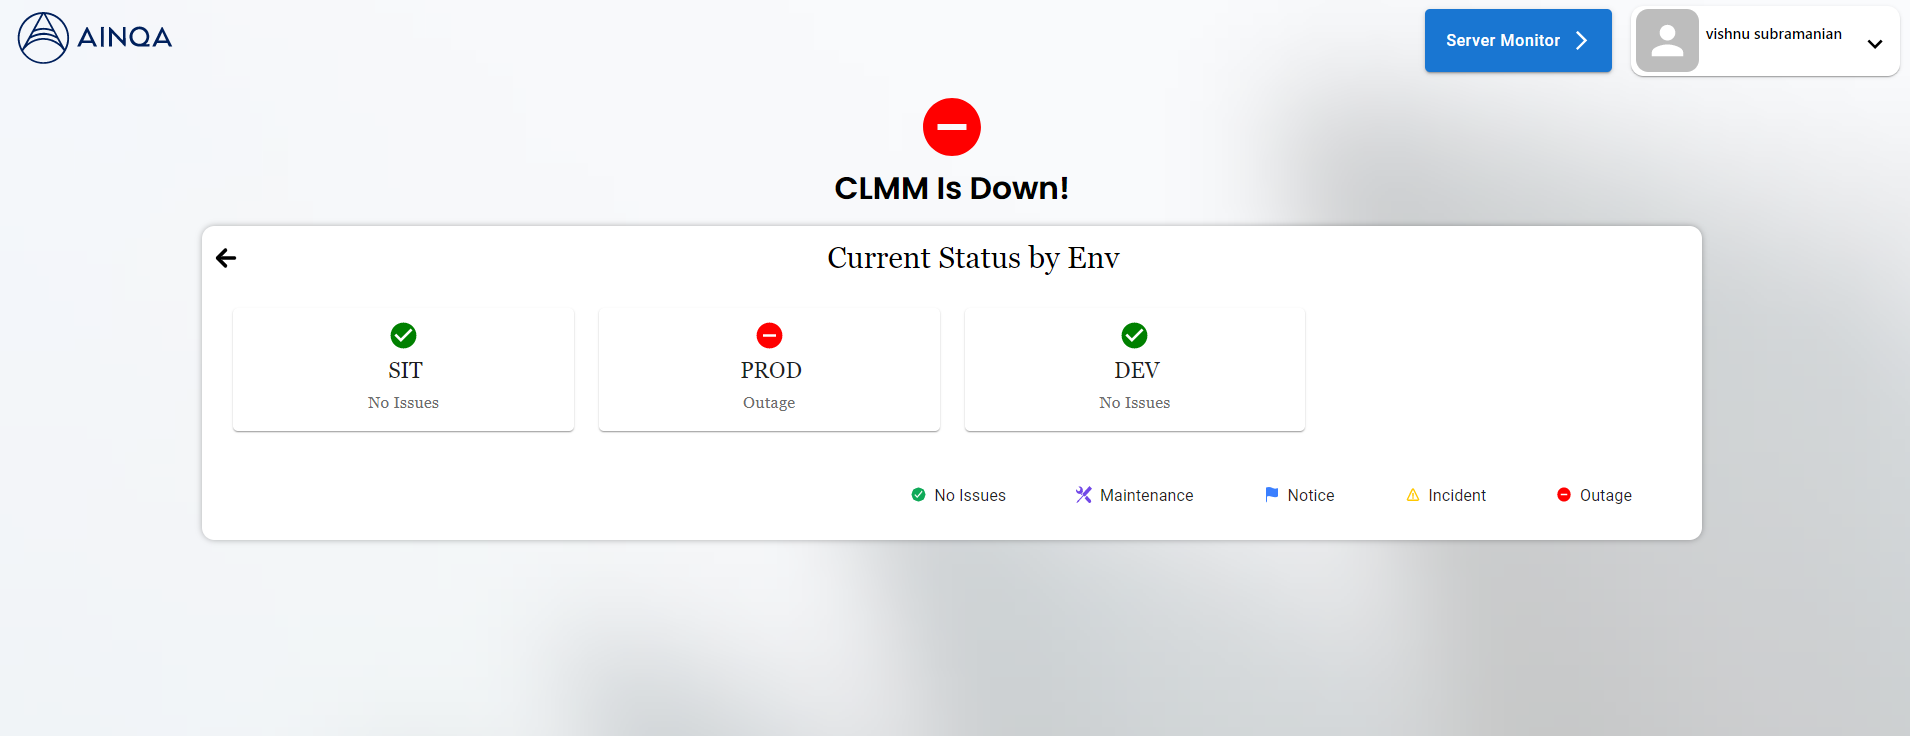
Project Environment Dashboard
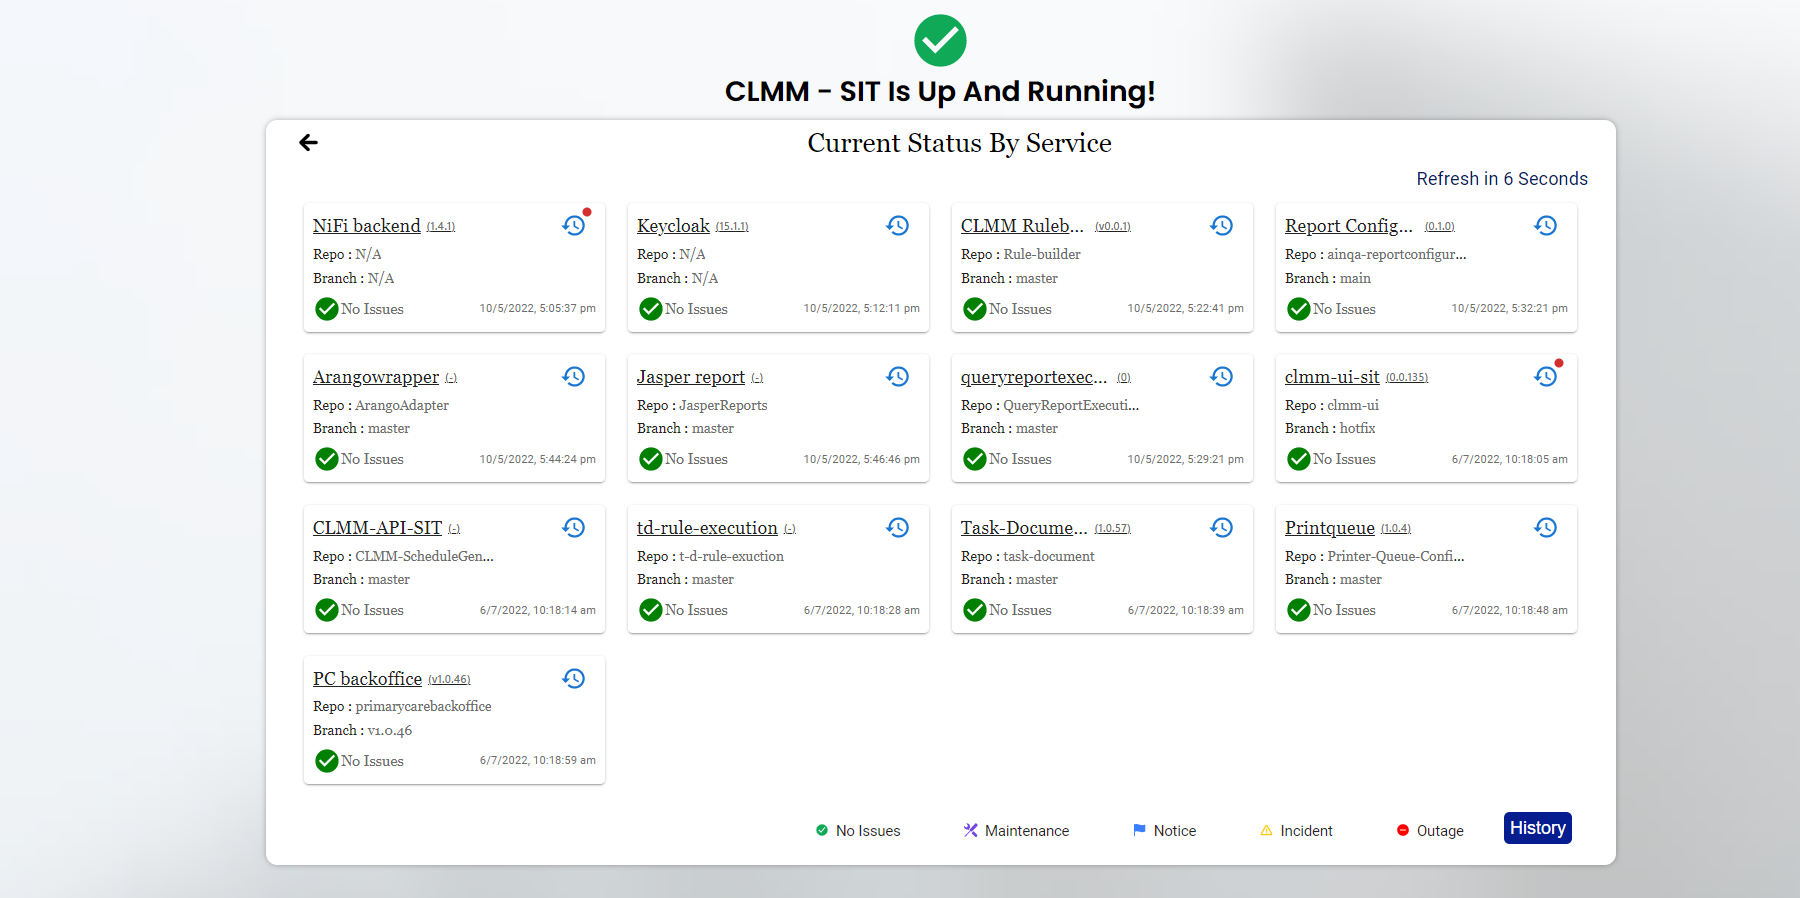
Click on any environment of the project to see the current status of environment by service.
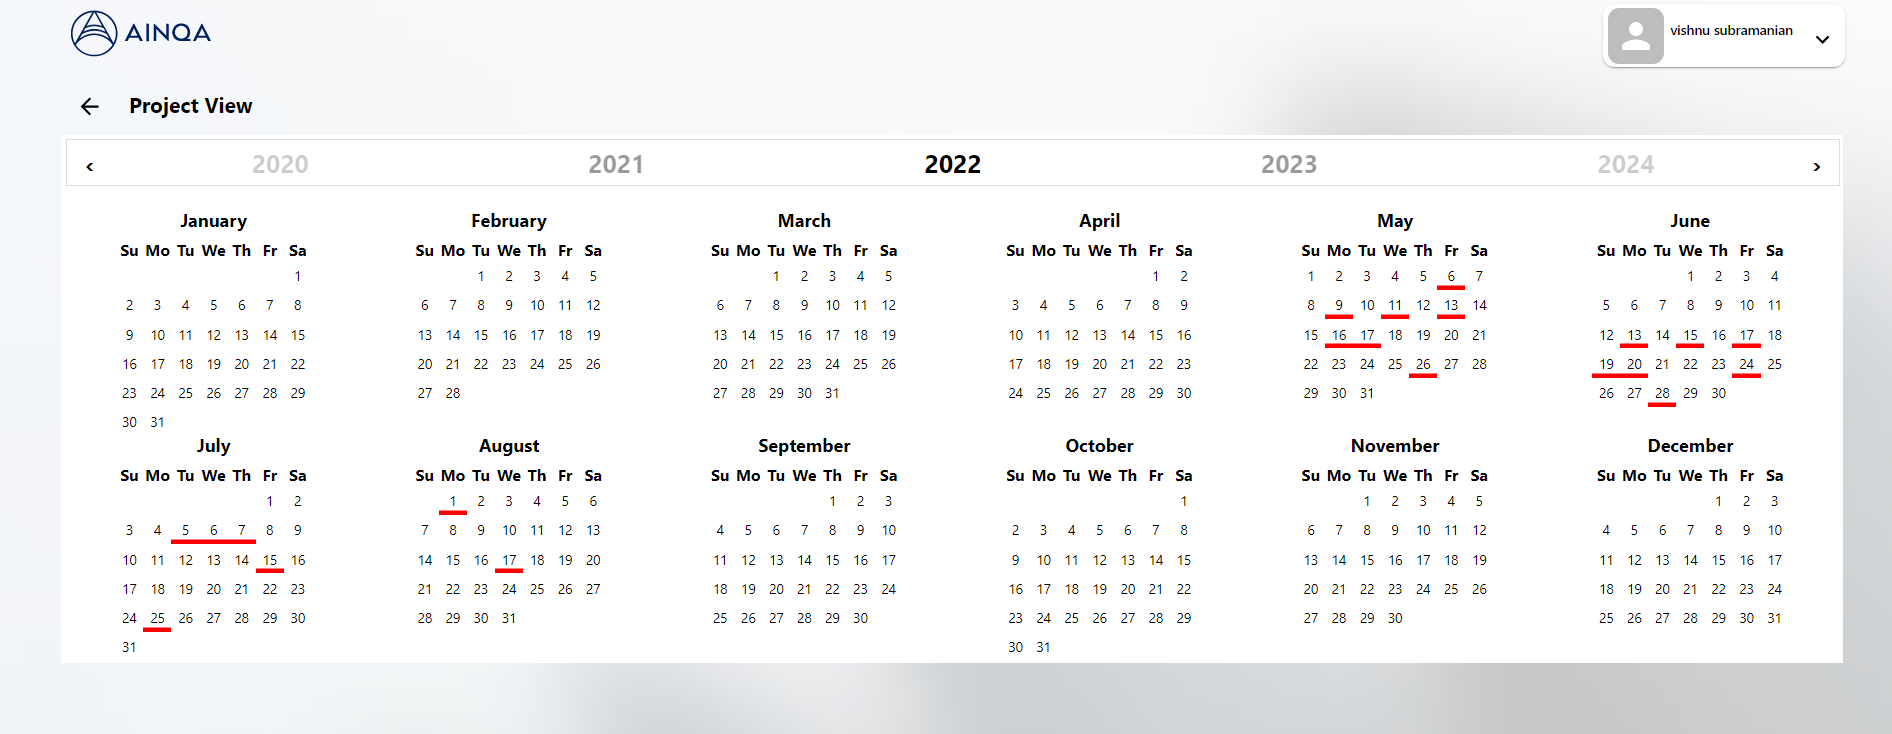
Status History
Users can see the history of project status in a calendar view.
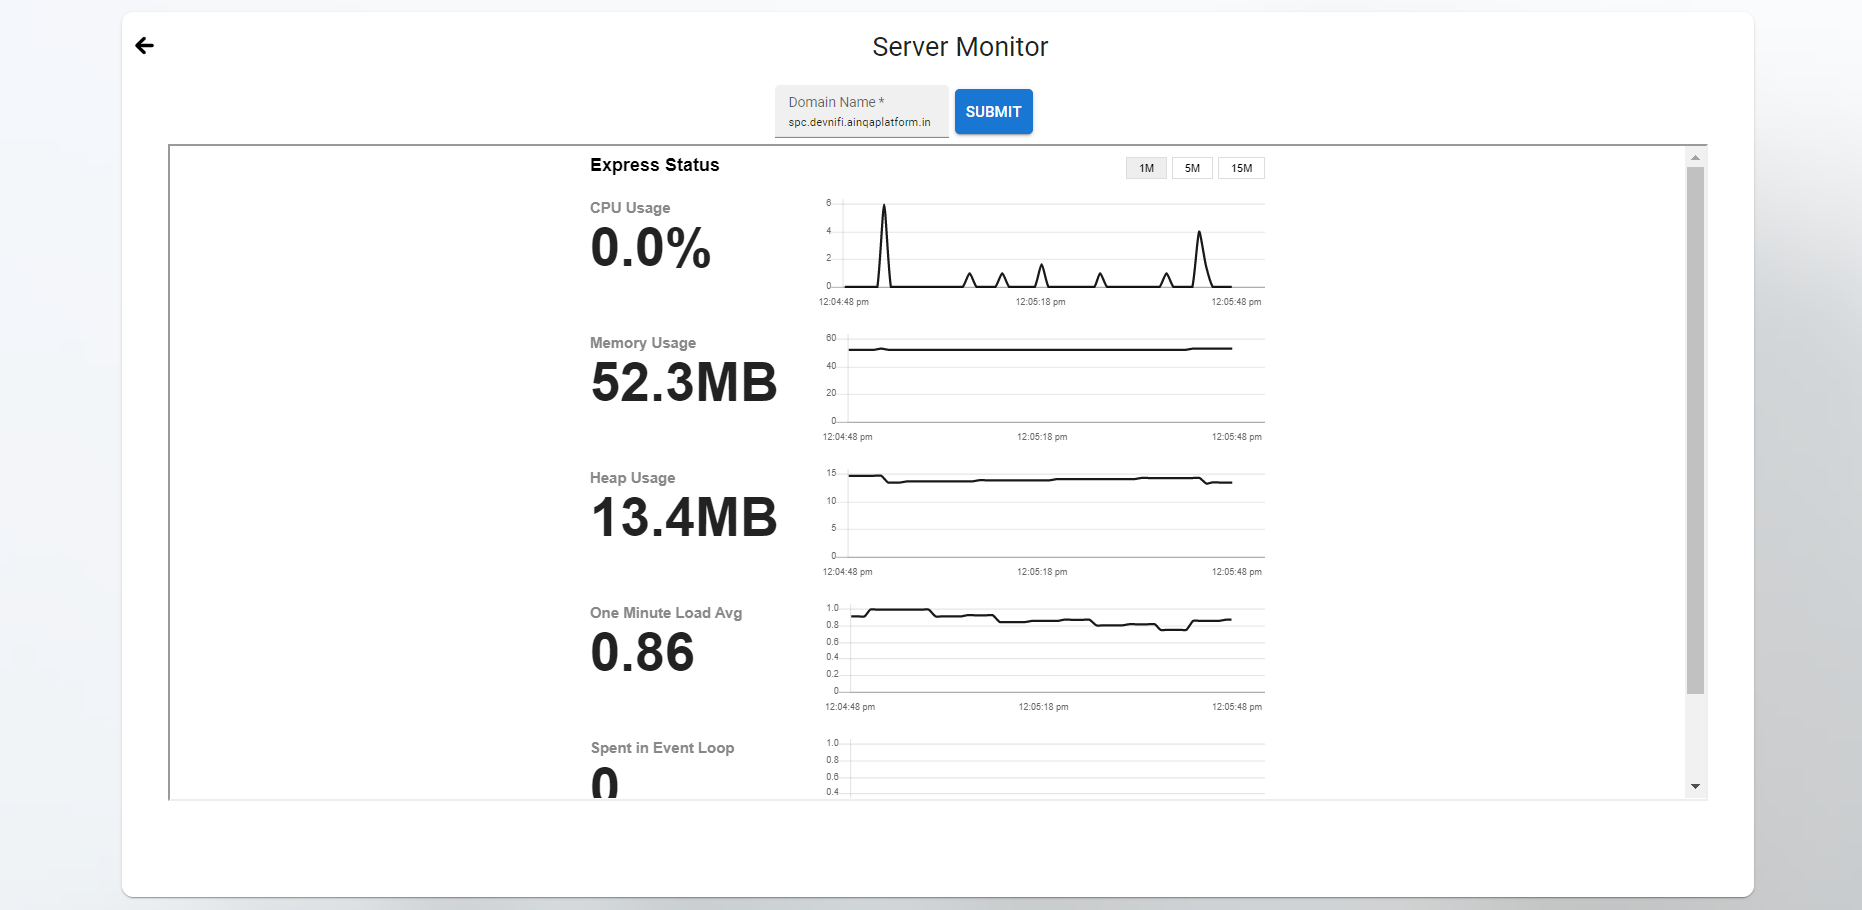
Server Monitoring
It allows user to view the status of the CPU, Memory Usage, Heap Memory and Response Time of servers.